Log#003: Küresel Veriden Yerel Gerçekliğe
Küresel modellerin 27 km'lik verilerini yerel topografya ile 30 metre çözünürlüğe indirgeme süreci. Digital Twin teknolojisi ile atmosferik yerelleştirme.
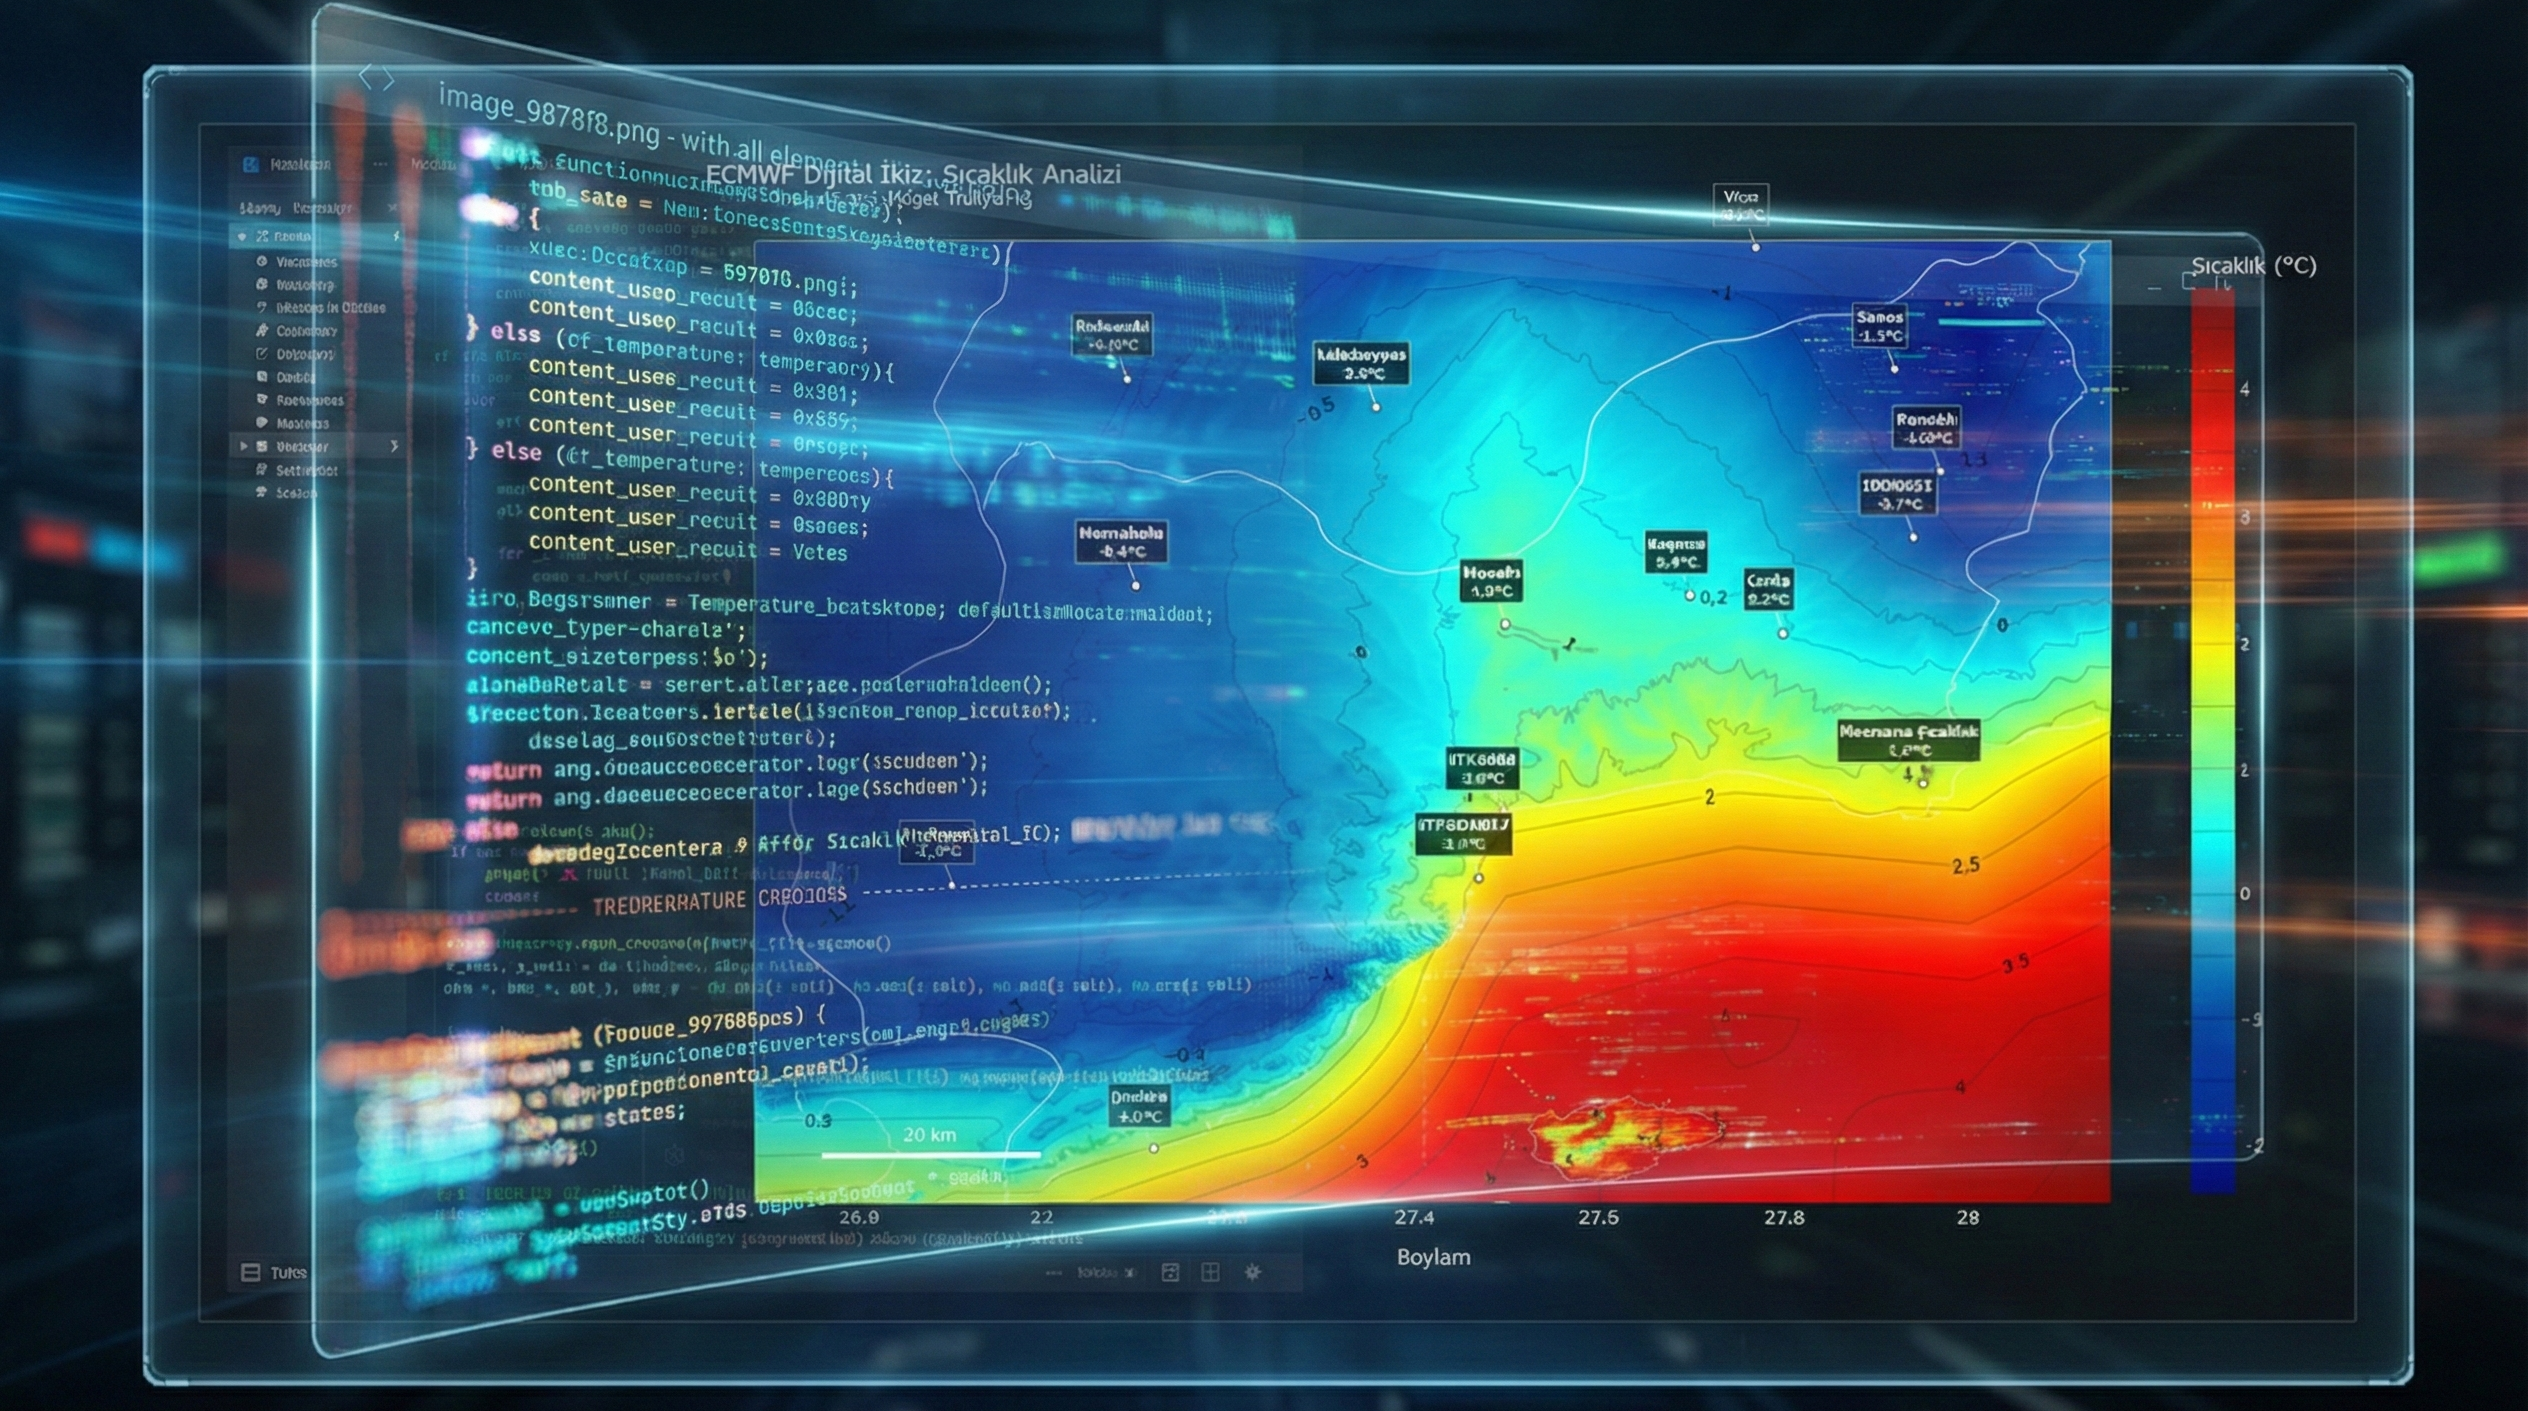
Küresel Veriden Yerel Gerçekliğe: Atmosferik Çözünürlüğü Dijital İkiz ile 30 Metreye İndirgemek
Dijital İkiz (Digital Twin) kavramı, atmosfer bilimlerinde heyecan verici kapılar açıyor. Bu çalışmadaki temel motivasyon; atmosferin o karmaşık ve kaotik yapısını bilgisayar ortamında gerçeğe en yakın şekilde modelleyebilmek. Pencereden dışarı baktığımızda gördüğümüz hava olaylarının ötesinde, bu sistemlerin yerel ölçekteki (vadi, tepe, sahil şeridi) etkilerini görebilmek ancak veriyi “yerelleştirmekle” mümkün oluyor.
Bu yazıda, ECMWF’in küresel verilerini evimizin bahçesindeki mikro iklim seviyesine indirme sürecindeki teknik detayları paylaşıyorum.
Çözünürlük Problemi ve Veri Kaynakları
ECMWF, “Open Data” kapsamında değerli veriler sunsa da halka açık bu veriler yaklaşık 27 km’lik gridler halinde geliyor. Model, bu devasa alanı tek bir nokta gibi kabul ediyor; oysa gerçekte bu mesafe içinde vadi ve tepeler gibi sıcaklığı doğrudan etkileyen büyük farklar var.
Bu boşluğu doldurmak için iki veri setini birleştirdik:
Atmosferik Veri: ECMWF GRIB2 formatındaki ham veriler. Arazi Verisi: OpenTopography üzerinden alınan 30 metre çözünürlüklü DEM (Dijital Yükseklik Modeli).
Yöntem: 900 Kat Daha Hassas Bir Bakış
27.000 metreden 30 metreye inmek, lineer çözünürlükte 900 katlık bir hassasiyet artışı anlamına geliyor. Süreç şu iki ana adımda ilerliyor:
Bilinear Interpolation (Veri Yumuşatma): 4 köşe mantığıyla gelen veriyi, 30 metrelik noktalara ağırlıklandırarak dağıttık ve pürüzsüz bir “atmosfer örtüsü” elde ettik. Lapse Rate (Fiziksel Düzeltme): ECMWF’den gelen jeopotansiyel verisi ile gerçek yüksekliği karşılaştırdık. Aradaki farkı atmosferin o anki soğuma katsayısı ile çarparak sıcaklığı topoğrafyaya göre düzelttik.
Analiz Sonuçları: Trakya Bölgesi Örneği
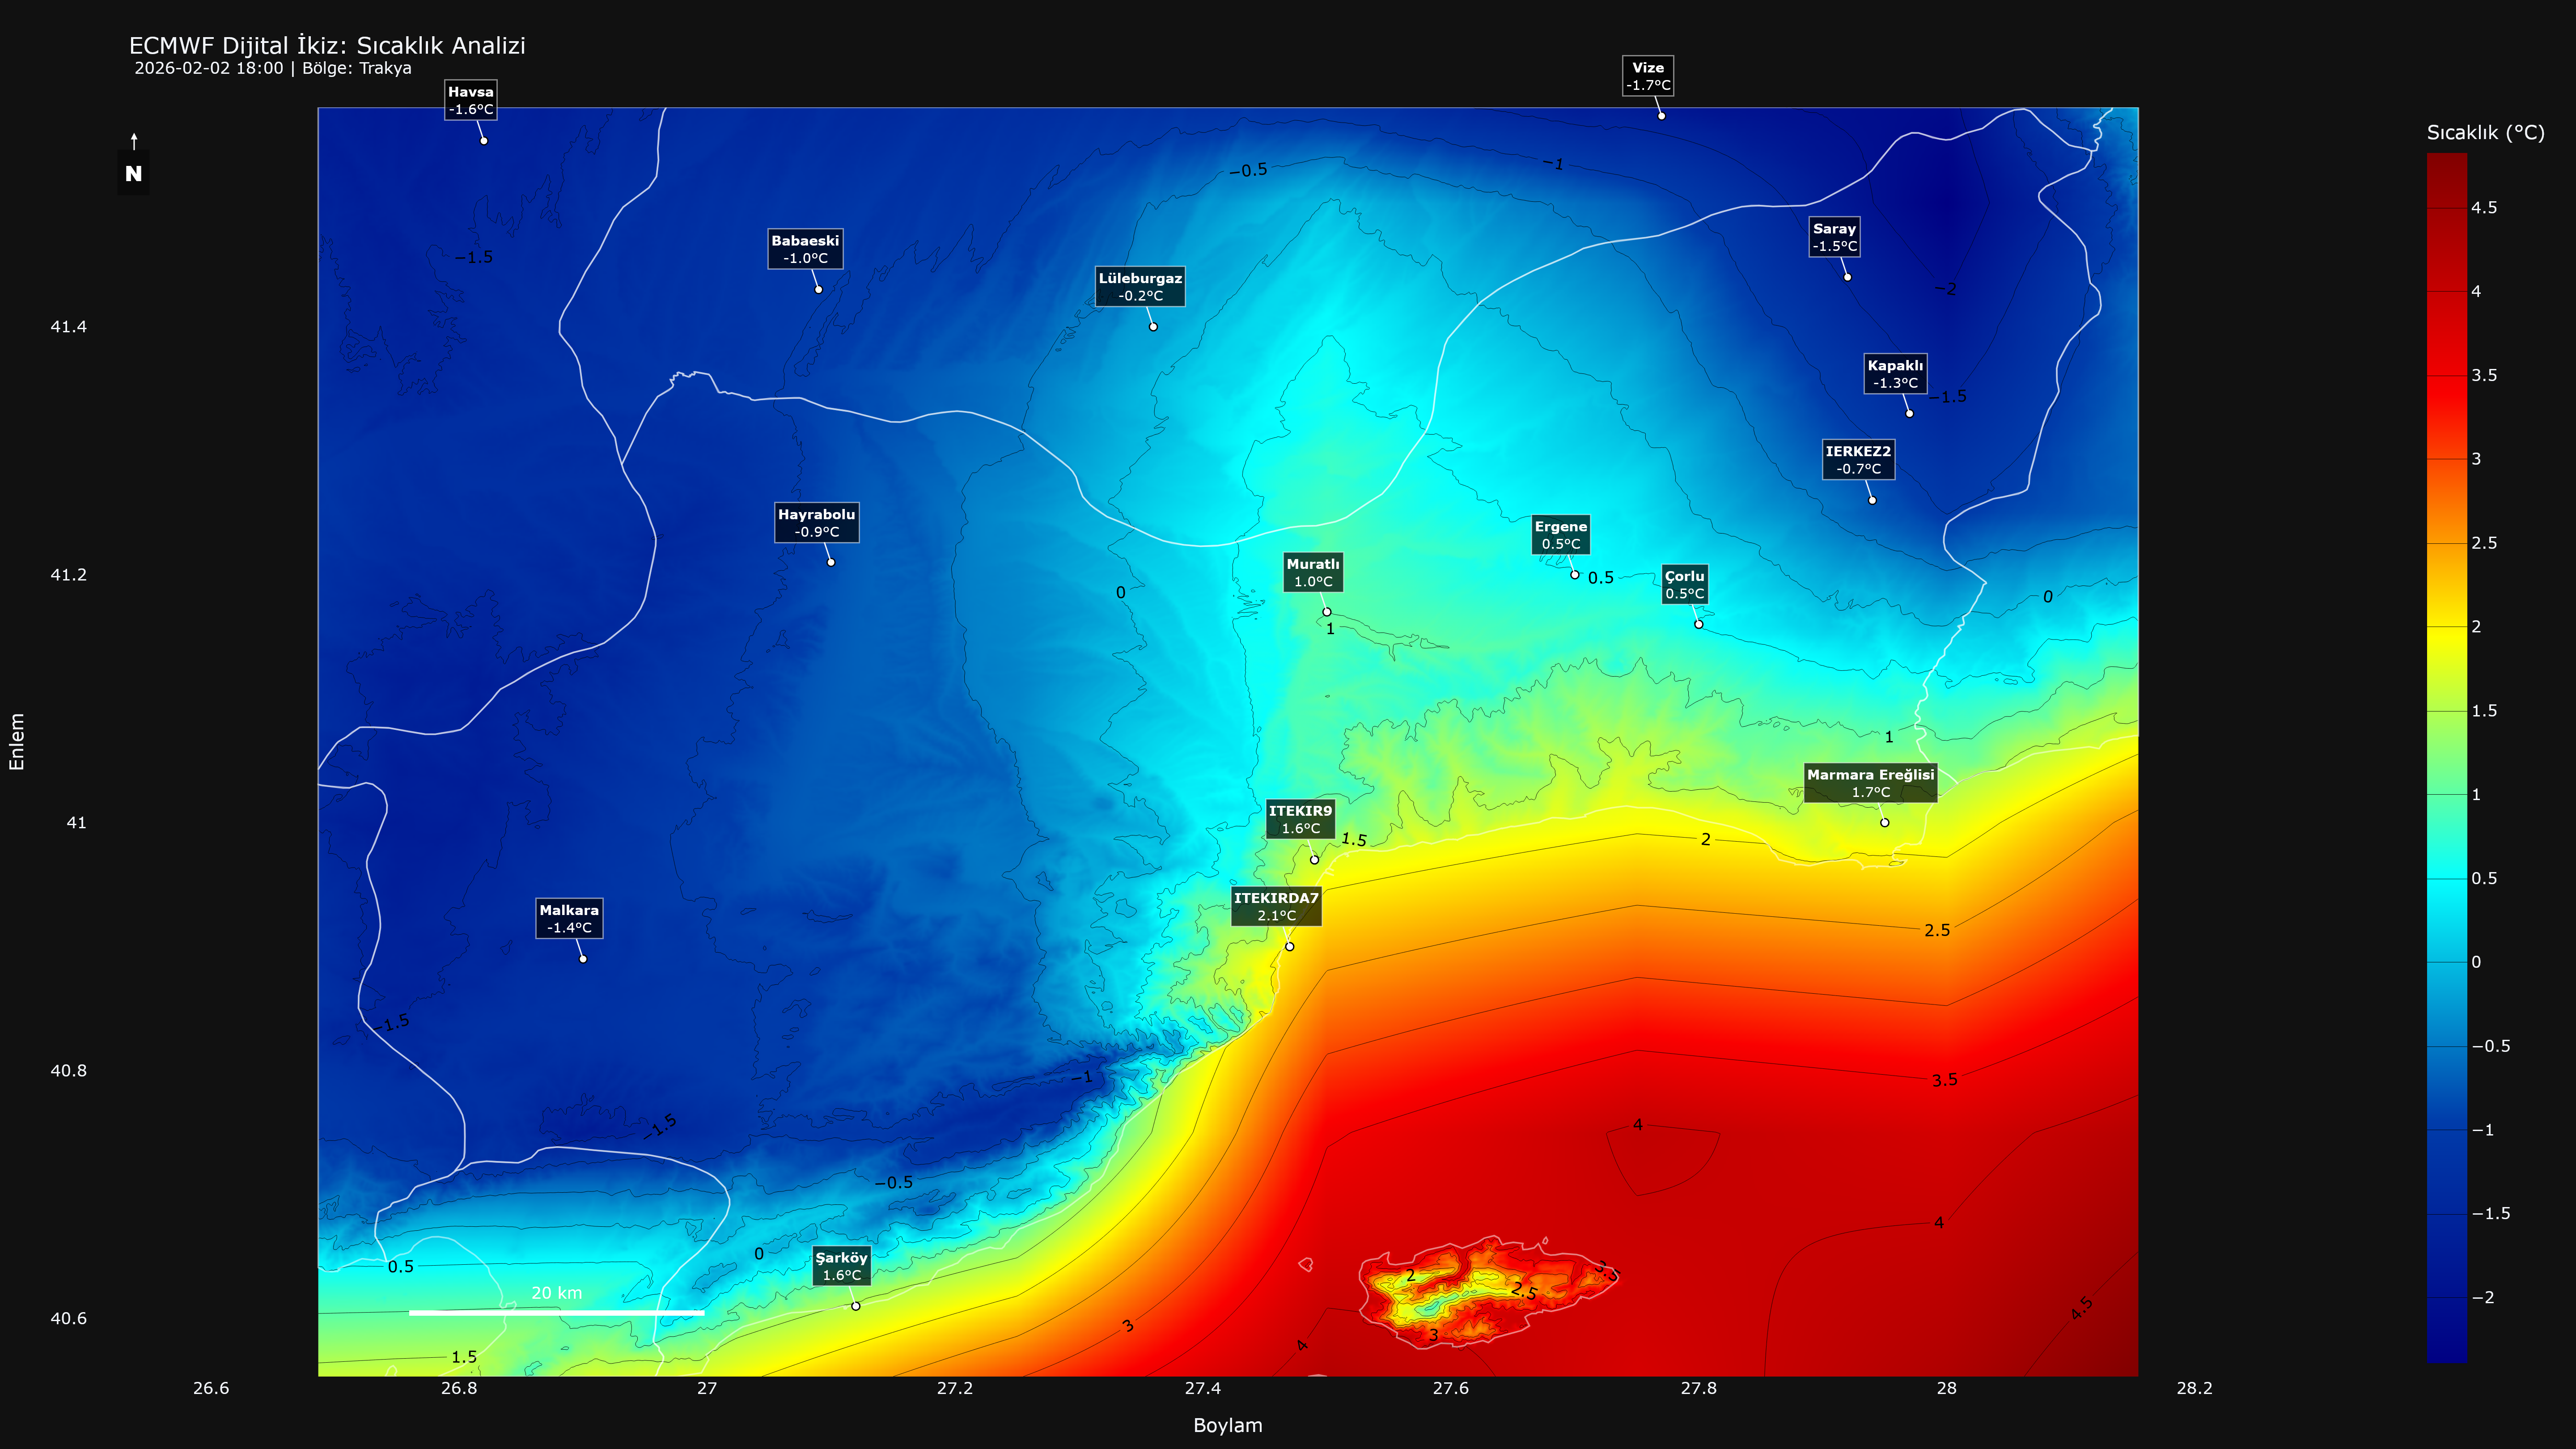
Teorik yaklaşımı pratiğe döktüğümüzde karşımıza çıkan sonucu aşağıdaki görselde görebilirsiniz. 27 km’lik kaba verinin, 30 metre çözünürlüğünde vadinin dibini de dağın zirvesini de tanıyan bir yapıya nasıl dönüştüğü, kıyı şeridi ve topoğrafya üzerindeki sıcaklık dağılımıyla net bir şekilde anlaşılıyor.
İstisnalar: İnversiyonu Yakalamak
Her zaman “yukarı çıktıkça hava soğur” kuralı işlemez; kış gecelerindeki sıcaklık terselmesi (inversiyon) durumlarında modelimiz 850 hPa sıcaklığını referans alarak akıllı davranıyor. Eğer yukarıda hava daha sıcaksa, model bunu taklit ederek vadileri soğuk, tepeleri sıcak gösteriyor.
Sonuç ve Açık Veri Vizyonu
Bu çalışma, açık kaynak verilerin süper bilgisayar çıktılarını nasıl kişiselleştirilebileceğinin bir kanıtı. OpenTopography ve ECMWF’e bu imkanları sundukları için minnettarız. MGM gibi kurumların da verilerini amatör araştırmacılara açması, bu ekosistemin gelişimine büyük katkı sağlayacaktır.
English Version
From Global Data to Local Reality: Increasing Atmospheric Resolution by 900x via Digital Twin
The concept of a “Digital Twin” is opening exciting doors in atmospheric sciences. The primary motivation of this study is to simulate and reconstruct the complex and chaotic behavior of the atmosphere in a digital environment as realistically as possible. Beyond the weather we see from our windows, understanding the impact of these systems on a local scale (valleys, peaks, coastlines) is only possible by “localizing” the data.
In this post, I am sharing the technical details of the process used to downscale ECMWF global data to the microclimate level of our own backyards.
The Resolution Challenge and Data Sources
While ECMWF provides invaluable data under its “Open Data” initiative, these public datasets are provided in approximately 27 km grids. The model treats this massive area as a single point; however, in reality, this span includes valleys and hills that directly affect temperature.
To bridge this gap, we combined two datasets:
Atmosferic Data: Raw ECMWF data in GRIB2 format. Terrain Data: 30-meter resolution DEM (Digital Elevation Model) from OpenTopography.
Methodology: A 900-Fold Increase in Precision
Moving from 27,000 meters to 30 meters represents a 900-fold increase in linear resolution. The process follows two main steps:
Bilinear Interpolation (Data Smoothing): We distributed the 4-corner grid data to each 30-meter point using distance-based weighting, creating a smooth “atmospheric blanket”. Lapse Rate (Physical Correction): We compared the geopotential data from ECMWF with the actual elevation from the DEM. By multiplying the difference with the current lapse rate, we corrected the temperature according to the topography.
Analysis Results: Thrace Region Example
You can see the results of putting this theoretical approach into practice in the image below. It clearly demonstrates how the coarse 27 km data is transformed into a structure that recognizes both valley floors and mountain peaks at 30-meter resolution, showing the distinct temperature distribution along the coastline and topography.
Exceptions: Capturing Inversion
The rule “it gets colder as you go higher” does not always apply; during winter nights with temperature inversions, our model acts intelligently by referencing the 850 hPa temperature. If the upper air is warmer, the model reflects this by showing valleys as cold and peaks as warm.
Conclusion and Open Data Vision
This study serves as proof of how open-source data and curiosity can personalize supercomputer outputs. We are grateful to OpenTopography and ECMWF for providing these resources to enthusiasts. We hope that institutions like the Turkish State Meteorological Service (MGM) will also open their data to amateur researchers, contributing significantly to the growth of this ecosystem.