Log #002: Atmosferin Dansı
Bir fırtınanın, sayılardan önce bir yapısı olduğunu gösteren kısa bir basınç gözlemi.
Atmosferin Dansı: Görünmez Akışkanın İzinde
Geçtiğimiz günlerde yaşadığımız şiddetli fırtına, bize atmosferin yıkıcı gücünü bir kez daha hatırlattı. Peki ama nasıl oluyor da böylesine bir güç; binalara, ağaçlara ve şehirlere bu denli zarar verebiliyor? Bu gücü sadece teorik olarak anlamak bir yana, onu avucumun içinde görüyormuşçasına somutlaştırmak benim için her zaman büyüleyici bir tutku olmuştur. Gerçek gücü ölçeklemek, küçültmek ve oluşan fenomenlere farklı açılardan bakabilmek, doğanın işleyişini kavramamızı sağlar.
Bir benzetme yapalım: Denizde yüzerken dev bir dalga geldiğinde, suyun altındaysanız o dalga sizi olduğunuz yerden koparıp sürükler. Zemindeki kumun nasıl da havalandığını, canlıların nasıl savrulduğunu görebilirsiniz. Aslında yüzeyde gördüğümüz tüm köpürmeler ve dalgalanmalar, suyun en derinlerine kadar nüfuz edebilir. Eğer suyun tabanına bir barometre yerleştirirseniz, üzerinizden bir dalga geçerken basınç değişimini anlık olarak hissedebilirsiniz.
İşte atmosfer de tıpkı su gibi bir akışkandır. Başınızı kaldırıp yukarı baktığınızda gökyüzü atmosfer boyunca uçsuz buçaksız bir boşluk gibi görünse de aslında havanın yoğunluğuna bağlı olarak sahip olduğu ağırlık sürekli değişim göstermektedir. Denizdeki dalgaların saniyeler süren frekanslarının aksine, atmosferdeki basınç değişimleri günler sürebilir.
Bu yazıda; Marmara Bölgesi üzerinde son günlerde yaşanan lodos fırtınası sırasında basıncın zamansal ve mekânsal olarak nasıl dalgalandığını ve bu dalgalanmaların neyi işaret ettiğini anlamaya çalışıyorum.
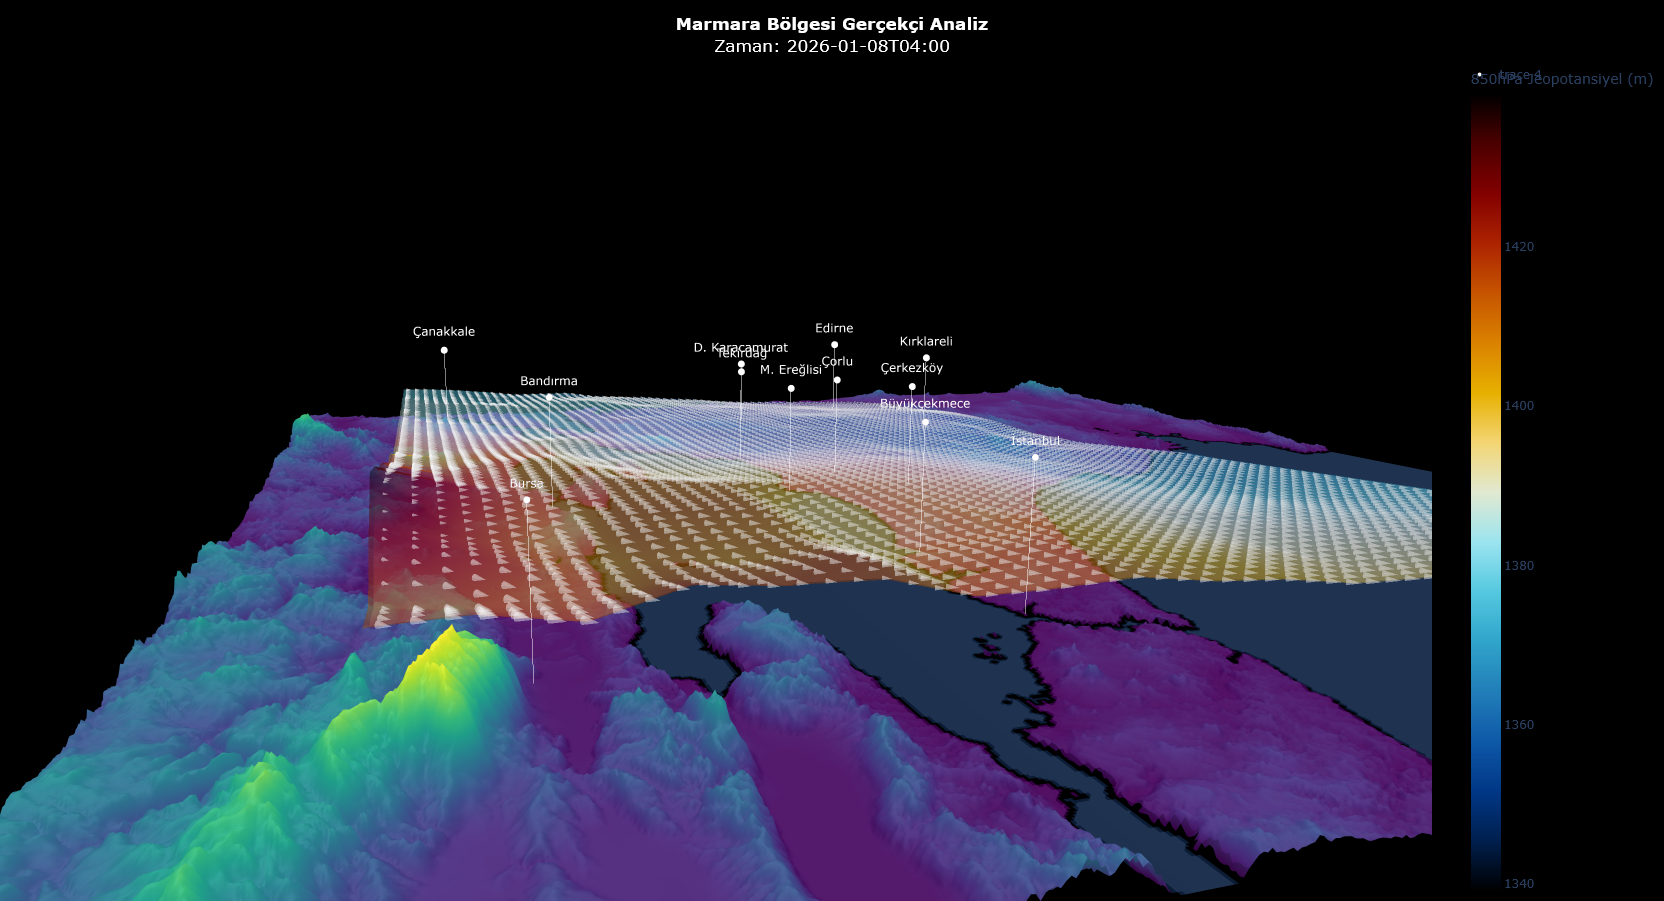
Aşağıdaki simülasyon, belirli bir zaman dilimine ait atmosferik hareketlerin anlık görüntüsüdür. Model içerisinde serbestçe gezinebilir ve farklı açılardan basınç dalgalanmalarını inceleyebilirsiniz:
Bu çalışmada görselleştirme için 850 hPa seviyesini ve jeopotansiyel yüksekliği kullandım. Atmosferde yükseklik arttıkça basınç belirli bir oranda düşer. Ölçümlerde 850 hPa değerinin yaklaşık 1500 metre rakıma sahip olması gerekirken, yoğunluk ve sıcaklık farkları nedeniyle bu değer değişir. Verileri Open-Meteo API üzerinden yaklaşık 11 km’lik grid noktalarından alarak, kesintisiz bir doku elde etmek için Cubic Interpolation (Kübik İnterpolasyon) yöntemiyle işledim.
API Veri Kesiti
| Zaman (UTC) | Enlem | Boylam | Jeo. Yükseklik (m) | Rüzgâr Hızı (km/h) | Rüzgâr Yönü (°) | Sıcaklık (°C) |
|---|---|---|---|---|---|---|
| 2026-01-06 08:00 | 40.0 | 27.2 | 1489.0 | 52.8 | 219 | 8.3 |
| 2026-01-06 12:00 | 40.0 | 27.2 | 1477.0 | 65.0 | 218 | 9.1 |
| 2026-01-06 16:00 | 40.0 | 27.2 | 1475.0 | 87.2 | 203 | 7.5 |
| 2026-01-06 20:00 | 40.0 | 27.2 | 1474.0 | 69.5 | 211 | 9.1 |
Simülasyonda gözlemlenen kırmızı bölgeler yüksek irtifayı, mor bölgeler ise alçak basınç oluklarını temsil ediyor. Tespit ettiğimiz 234 metrelik jeopotansiyel fark, havanın şiddetli bir fırtına şeklinde akması için fazlasıyla yeterli.
Peki, bu dalgalanmalar gerçekten rastgele mi yoksa görmediğimiz devasa bir yapının yüzeye çıkan izleri mi?
English Version
Dance of the Atmosphere: Tracing the Invisible Fluid
The severe storm we recently experienced was a stark reminder of the atmosphere’s destructive power. But how does such a force cause such significant damage to buildings, trees, and cities? Beyond understanding this power theoretically, I have always been fascinated by the idea of visualizing it as if it were in the palm of my hand. Scaling down and observing these phenomena from different angles allows us to truly grasp the mechanics of nature.
Let’s use an analogy: When a massive wave hits while you are swimming underwater, it drags you away from your position. You can see how the sand on the seabed is stirred up and how marine life is tossed around. In reality, all the churning and waving we see on the surface penetrates down to the depths. If you were to place a barometer on the seafloor, you would feel the pressure change instantly as a wave passes over you.
The atmosphere is a fluid, just like water. Although the sky may seem like an endless void as you look up through the atmosphere, the weight it exerts constantly changes depending on the density of the air. Unlike the seconds-long frequency of ocean waves, atmospheric pressure changes can last for days.
In this article, I attempt to understand how pressure fluctuated both temporally and spatially during the recent Lodos storm over the Marmara region, and what these fluctuations truly signify.
The simulation below is a snapshot of atmospheric movements at a specific hour. You can navigate freely within the model and examine pressure fluctuations from different angles:
For this visualization, I utilized the 850 hPa level and geopotential height. While the 850 hPa value should ideally correspond to an altitude of 1500 meters, this value fluctuates due to density differences. I obtained the data via the Open-Meteo API from grid points spaced approximately 11 km apart, processing it with the Cubic Interpolation method to achieve a seamless texture.
API Data Sample
| Time (UTC) | Latitude | Longitude | Geo. Height (m) | Wind Speed (km/h) | Wind Dir (°) | Temp (°C) |
|---|---|---|---|---|---|---|
| 2026-01-06 08:00 | 40.0 | 27.2 | 1489.0 | 52.8 | 219 | 8.3 |
| 2026-01-06 12:00 | 40.0 | 27.2 | 1477.0 | 65.0 | 218 | 9.1 |
| 2026-01-06 16:00 | 40.0 | 27.2 | 1475.0 | 87.2 | 203 | 7.5 |
| 2026-01-06 20:00 | 40.0 | 27.2 | 1474.0 | 69.5 | 211 | 9.1 |
The red areas in the simulation represent high geopotential height, while the purple areas represent low-pressure troughs. The 234-meter difference observed is more than enough to trigger the air to flow in the form of a violent storm.
So, are these fluctuations truly random, or are they the visible traces of a massive, unseen structure surfacing before our eyes?